
SMCI Stock After Q4 FY26: Why Margins Beat the Revenue Miss

 Prefer us on Google

Super Micro Computer (NASDAQ: SMCI) closed at $31.60 on August 11, 2026, then jumped 7.6% to $33.99 in after-hours trading once its fiscal Q4 numbers hit the tape. The headline revenue figure actually missed. The stock rallied anyway — and the reason is the single most useful thing to understand about SMCI stock right now.
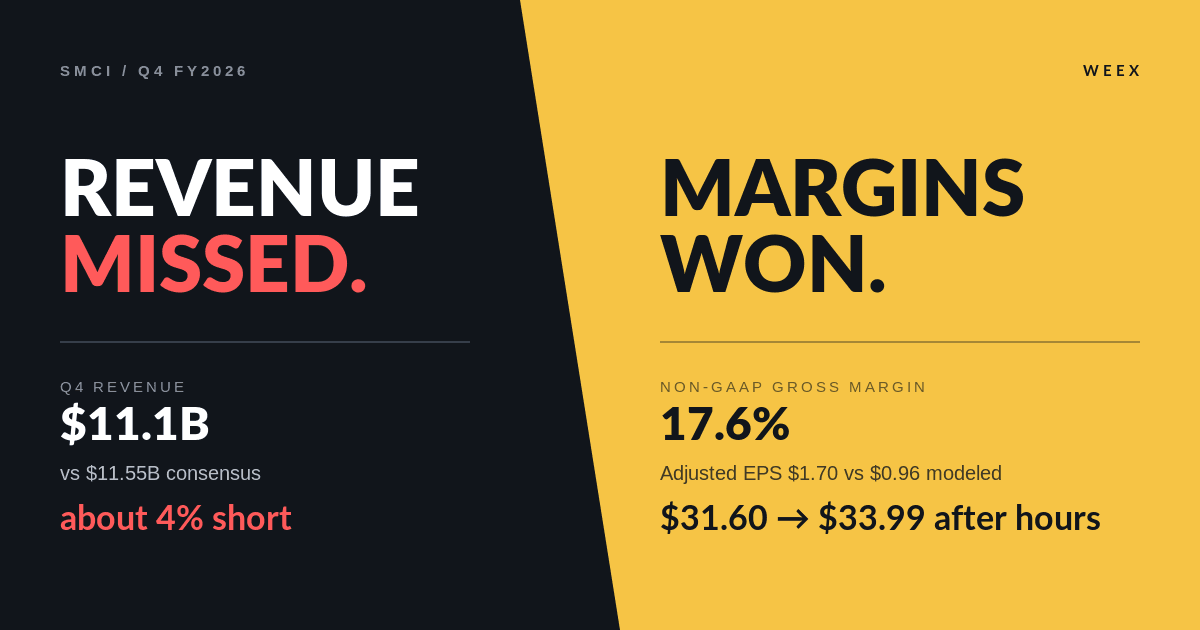
Supermicro delivered $11.1 billion in Q4 revenue against a roughly $11.55 billion consensus. It also delivered a 17.6% non-GAAP gross margin and $1.70 in adjusted EPS versus the $0.96 the street modeled. For a company whose entire bear case was "it sells AI servers at almost no profit," that margin line matters more than a 4% top-line shortfall.
Here is what the quote pages won't tell you: SMCI now trades in three places at once — as a NASDAQ equity, and as two separate tokenized wrappers with wildly different liquidity. The gap between them is where retail traders get hurt.
SMCI stock price today and the key numbers
All figures below are as of the August 11, 2026 close, sourced from consolidated market data via StockAnalysis and the company's Q4 FY2026 release.
| Metric | Value |
|---|---|
| Last close (Aug 11, 2026) | $31.60 (+0.45%) |
| After-hours (Aug 11, 7:59 PM EDT) | $33.99 (+7.56%) |
| 52-week range | $19.48 – $58.78 |
| Market cap | $20.44B (−23.2% YoY) |
| Shares outstanding | 646.87M |
| P/E (trailing) | 16.57 |
| Forward P/E | 9.54 |
| Beta | 1.97 |
| Analyst consensus (19 analysts) | Hold, $37.81 target |
Two numbers there deserve a second look. A 9.54 forward P/E on a company guiding to 66%–84% revenue growth is not a normal valuation — it is the market pricing in serious doubt about whether the earnings show up. And a beta of 1.97 tells you this is roughly twice as volatile as the index, which is why position sizing matters more here than in most large-cap tech.
Why SMCI stock fell 46% from its 52-week high
SMCI peaked at $58.78 on October 9, 2025 and spent most of the following ten months bleeding out. The cause was never demand — it was the price Supermicro paid to win demand.
For several quarters, SMCI booked enormous AI server revenue at gross margins in the single digits. Fiscal Q3 non-GAAP gross margin came in at 10.1%, itself a recovery from 6.4% the quarter before. Dell and HPE were ramping competing rack-scale systems, GPU and HBM costs stayed elevated, and hyperscale customers had enough leverage to squeeze integrators on price. The market's read was blunt: Supermicro was a pass-through business booking someone else's revenue.
That framing broke on July 21, 2026, when the company pre-announced a gross margin range of 15%–17% against prior guidance of 8.2%–8.4% — roughly a doubling — and disclosed more than $60 billion in new orders booked in a single quarter. The Q4 print on August 11 confirmed it at 17.6%.
The Q4 FY26 scorecard: what beat and what missed
| Line item | Q4 FY26 actual | Expectation / prior |
|---|---|---|
| Revenue | $11.1B (+93% YoY) | ~$11.55B consensus — miss |
| Non-GAAP gross margin | 17.6% | 8.2%–8.4% original guide — large beat |
| Non-GAAP EPS | $1.70 (+315% YoY) | $0.96 consensus — beat |
| GAAP net income | $1.17B | $195.2M year-ago |
| New orders booked | >$60B in the quarter | Record |
| FY27 revenue guidance | $65B–$72B | $53.29B consensus — large beat |
| Q1 FY27 revenue guidance | $14.5B–$15.5B | — |
Full-year FY2026 revenue landed at $39.06 billion, up 77.8% from $21.97 billion, with earnings of $2.22 billion, up 111.4%.
The FY27 guidance is the aggressive part. Guiding $65–72 billion against a $53.29 billion consensus is a 22%–35% overshoot of what analysts believed possible. Management is effectively telling the market that the $60 billion order book converts. If it does, the forward multiple is absurd. If conversion slips a quarter or two — a normal thing in AI infrastructure, where customers routinely push delivery dates — the stock re-rates down hard, because the entire bull case is now backlog conversion.
Is SMCI stock a good buy right now?
Nineteen analysts covering the name rate it Hold with a $37.81 average target, about 20% above the last close. That consensus was set largely before the Q4 print, so expect revisions.
| Bull case | Bear case |
|---|---|
| Margin doubled to 17.6%; the "no-profit business" thesis is damaged | One quarter is not a trend — mix, not structural pricing power, drove it |
| $60B+ orders in a single quarter, record backlog | Backlog is not revenue; AI customers delay deliveries routinely |
| FY27 guide $12B–$19B above consensus | Aggressive guides invite brutal punishment if missed |
| Forward P/E of 9.54 on 66%–84% guided growth | Cheap multiple reflects governance history and earnings-quality doubt |
| Direct liquid-cooling and DCBBS position in rack-scale AI | Dell, HPE and Lenovo compete directly and are better capitalized |
The more useful framing than "buy or not" is this: SMCI is no longer a demand story, it is an execution story. Demand is settled — $60 billion in a quarter settles it. What is unsettled is whether Supermicro can hold mid-teens margins while shipping at that scale, and whether the orders convert on schedule. Every quarter from here is a referendum on those two questions, which is why the stock will keep moving 8%–15% on earnings.
Trading SMCI as a token: SMCIx, SMCIB and the liquidity trap
This is where most SMCI coverage stops and where the practical risk actually sits. Super Micro exists in tokenized form through at least two issuers, and the price you see is not always the price the equity is trading at.
| Instrument | Venue type | Reference price | 24h volume | Market cap |
|---|---|---|---|---|
| SMCI (equity) | NASDAQ | $33.99 after-hours, Aug 11 | 95.97M shares | $20.44B |
| SMCIx (xStock, Backed) | Crypto exchanges / DEX | $32.70 | $1.31K | $257.59K |
| SMCIB (bStocks) | Crypto exchanges | — | ~$8.55K | ~$538.96K |
SMCIx data is from the WEEX SMCIx price page, last updated 2026-08-12 00:55 UTC. SMCIB figures are third-party aggregator data from the same period.
Read that table again. The equity turned over roughly 96 million shares on August 11. The xStock wrapper turned over $1,310 — not thousand-lots, $1,310 total. Its entire market cap is $257,590, against a $63.4 million fully diluted valuation on 1.94 million total tokens with only 7,880 circulating.
At roughly 8:55 PM EDT on August 11, an hour after the underlying printed $33.99 in after-hours trade, the SMCIx reference price sat at $32.70 — about 3.8% below. On a liquid instrument that gap arbitrages away in seconds. On $1,310 of daily volume, it does not, because there is nobody on the other side.
What experienced traders watch here: with a book that thin, a single $5,000 market order can move the token several percent, and you will pay that slippage on both entry and exit. Tokenized equity wrappers also convey no shareholder rights — no vote, and dividend treatment depends entirely on the issuer's terms. You are buying price exposure through a custodian, not stock.
Note that SMCIx is not currently listed for trading on WEEX; the platform tracks its price and publishes an SMCIx price prediction and technical outlook, and a step-by-step SMCIx acquisition guide covering the DEX route. Check listing status before assuming you can trade any tokenized ticker on a given venue — that assumption is a common and expensive mistake.
What will SMCI stock be worth in 2030?
Nobody knows, and anyone quoting a precise 2030 figure is generating content, not analysis. What can be framed is the range implied by the business.
| Scenario | Assumption | Rough implication |
|---|---|---|
| Backlog converts, margins hold mid-teens | FY27 lands near the $72B high end | Multiple expansion; the 9.54 forward P/E is the mispricing |
| Backlog converts, margins compress back to ~10% | Revenue grows, earnings quality stays poor | Range-bound; the stock stays a trading vehicle |
| Conversion slips or a large customer walks | FY27 lands below $53B consensus | Sharp de-rating; the $19.48 52-week low is the reference |
The honest answer is that SMCI's 2030 value depends almost entirely on whether AI capital expenditure holds at current levels for another four years, which is a macro bet, not a Supermicro bet. Its 1.97 beta already tells you the market treats it as a leveraged play on that theme.
The bottom line on SMCI stock
The August 11 report changed the SMCI stock argument in one specific way: it moved the debate from "can this company make money" to "can it keep making money at this rate." A 17.6% gross margin and $1.70 in adjusted EPS answered the first question. Only the next three or four quarters of backlog conversion will answer the second.
If you are trading SMCI exposure through tokenized wrappers rather than the equity, treat the liquidity data above as the primary risk, not the secondary one. A 3.8% pricing gap on $1,310 of daily volume is not a rounding error — it is the entire cost of your trade.
Track live pricing and technical readings on the WEEX SMCIx price page before sizing any position.
FAQ
1. Why did SMCI stock rise if revenue missed?
Because gross margin more than doubled. Q4 FY26 non-GAAP gross margin came in at 17.6% versus original guidance of 8.2%–8.4%, and adjusted EPS of $1.70 beat the $0.96 consensus by 77%. The market had been discounting SMCI as a low-margin assembler; that framing weakened.
2. What is SMCI's FY2027 revenue guidance?
$65 billion to $72 billion, against a $53.29 billion analyst consensus. Q1 FY27 is guided to $14.5–$15.5 billion. FY2026 finished at $39.06 billion.
3. Is SMCIx the same as SMCI stock?
No. SMCIx is a tokenized wrapper issued by Backed that tracks the SMCI share price. It carries no shareholder rights, trades on far thinner liquidity, and can price several percent away from the underlying — as it did on August 11, 2026, showing $32.70 against a $33.99 after-hours equity print.
4. Why is SMCI stock down from its high?
SMCI fell from $58.78 in October 2025 on gross margin compression, not weak demand. Aggressive pricing on AI server deals, elevated GPU and HBM component costs, and competition from Dell, HPE and Lenovo pushed margins into single digits before the July 2026 recovery.
5. What do analysts rate SMCI stock?
Hold, with a $37.81 average 12-month target from 19 analysts as of August 11, 2026 — roughly 20% above the close. Most of those targets predate the Q4 print and are likely to be revised.
6. Can I trade SMCI tokenized stock on WEEX?
SMCIx is not currently listed for trading on WEEX. WEEX publishes SMCIx price tracking, technical analysis and forecast pages. Always confirm live listing status on the exchange before planning a trade.
Risk Warning
SMCI is a high-beta equity (1.97) that has traded between $19.48 and $58.78 over the past 52 weeks and routinely moves 8%–15% on earnings. Its FY2027 guidance depends on converting a record backlog that has not yet been delivered; delivery delays are common in AI infrastructure and would materially change the earnings picture.
Tokenized equity wrappers such as SMCIx and SMCIB carry additional and distinct risks. Liquidity is a fraction of the underlying — SMCIx showed $1.31K in 24-hour volume against 95.97 million shares traded in the equity — which means wide spreads, severe slippage on modest order sizes, and potential inability to exit at the quoted price. Holders receive no voting rights and no direct shareholder benefits. You also take on issuer and custodian counterparty risk, smart-contract risk, and regulatory risk, as the treatment of tokenized securities is still developing across jurisdictions.
Crypto and tokenized assets are volatile and may result in partial or total loss of capital. Nothing here is investment advice. Verify current prices, listing status and issuer terms before trading, and never commit capital you cannot afford to lose.
This content is provided for general informational purposes only and doesn't constitute financial, investment, legal, or tax advice. Any events, rewards, online promotions, or related information mentioned herein should not be considered a recommendation, solicitation, or invitation to purchase, sell, trade, or otherwise deal in any crypto assets. Crypto assets are highly volatile and may result in loss. The availability of WEEX services, products, and related events may vary by region. You are responsible for ensuring that your participation is in accordance with applicable local laws and regulations.
You may also like

Is PROM Coin Safe? What Can and Cannot Be Verified About Prom

RKLB Stock After Q2: Record Revenue, Wider Loss, Narrower Window
TSMC Stock After Record Q2: Price, Valuation and 24/7 Access

Metaplanet (3350): What the Japanese Retail Boards Argue About — and How to Check Each Claim

How Euro-Area Macro Moves Bitcoin: ECB Rates, Energy, and the Euro-Denominated View (2026)
Hardware Wallet Security After the Coldcard Exploit: Custody Options Explained (2026)

What Is the Yen Carry Trade? How It Moves Bitcoin, Explained

Stock Market Futures: What They Price and When They Go Dark
Meme Coin Guide: Opportunities, Risks, and Strategy in 2026
Circle Stock Analysis: Business Model and Valuation in 2026

WEEX Trade to Earn Phase 2: Trade More but Pay Less in Futures Trading Markets

What is Canton Network: Pioneering Institutional Crypto with Canton Coin (CC) and Privacy-Preserving Blockchain Innovation
Introduction to Canton Network: A New Era for Institutional-Grade Digital Assets

What Is Recall Coin Crypto? A Deep Dive Into RECALL Token & the Recall Network
One-Click Margin Mode Setup for All Futures Pairs
Get Up To 100% APR On WEEX Auto Earn USDT
Crypto Trading vs.Traditional Investment, What's the Difference?

Why Celebrity Memecoins Often End in scandal and What Traders Can Learn?










Is PROM Coin Safe? What Can and Cannot Be Verified About Prom
RKLB Stock After Q2: Record Revenue, Wider Loss, Narrower Window
TSMC Stock After Record Q2: Price, Valuation and 24/7 Access
Metaplanet (3350): What the Japanese Retail Boards Argue About — and How to Check Each Claim
How Euro-Area Macro Moves Bitcoin: ECB Rates, Energy, and the Euro-Denominated View (2026)
Hardware Wallet Security After the Coldcard Exploit: Custody Options Explained (2026)
Contents
Popular coins
Latest articles


